The Earnings Whisper Grade measures the likelihood a stock will "drift" higher or lower during the 90 days following its earnings release
- PEAD occurs relative to the Earnings Whisper ® - not the consensus
- Sentiment can’t always be measured by just a number
- By grading the results relative to the Earnings Whisper and investor sentiment, we can identify where a stock lies in the Earnings Expectation Life Cycle
- Over the past 15 years, stocks with an A+ grade have outperformed the overall market by 259% per quarter
Most of everything Earnings Whispers does starts with a market phenomenon discovered by Ray Ball and Philip Brown in 1968, which they termed the Post-earnings Announcement Drift (PEAD). In their paper published in the Journal of Accounting Research titled "An Empirical Evaluation of Accounting Income Numbers," Ball & Brown provided the initial framework of what is now called Quantitative Financial Analysis by telling the world information in a single financial event can result in a stock statistically outperforming or underperforming the overall stock market in the future. This paper was important because it gave statistical evidence disproving the efficient market theory that all news gets priced into stocks immediately.
In fact, as Ball & Brown later pointed out, accounting literature at the time did not deem it "fruitful to investigate how financial statement information affects or is related to share prices." Now, roughly five decades later, there are hedge funds popping up all the time based on some new data point that they believe can outperform. Most of these are so far from the typical investor's mindset, such as one hedge fund's idea that you can outperform the market by 50 basis points by following the migration patterns of elephants in India that only the most eccentric, or perhaps the most diverse portfolios, need put their money into them.
We have read literally hundreds of research studies on what makes stocks move and hedge funds are often quick to jump on the band wagon of the latest study, but most of these have failed to hold up in different market conditions, which is likely a key reason why the majority of all hedge funds now underperform the overall market. One problem is most studies are for one specific timeframe or the majority of the gains came in just one specific period. For example, while we have read hundreds of studies, we have also performed thousands of our own studies on the price performance. One of our own studies initially appeared to be the holy grail of indicators until we realized that roughly 95% of all occurrences came in April of 2009 just as the overall market was bouncing off of a generational low and perhaps the buying opportunity of a lifetime. A study we read once indicated that using an investing strategy based on crowd-sourced expectations outperformed the overall market, but when looking at the details of the study, it was revealed that all of the gains came in 2011 and the strategy lost money in all other timeframes.
The one phenomenon that has been revisited by countless others that continues to outperform time and again is Ball & Brown's revelation that stocks of companies that beat earnings expectations "drift" higher in the weeks and even several months following the earnings announcement. The same holds true for stocks of companies that miss earnings expectations.
One problem Ball & Brown admittedly had back in 1968 was a lack of reliable means of determining market expectations prior to an earnings release. That's not a problem today and there have been continued studies proving the Post-earnings Announcement Drift phenomenon continues to exist. Victor Bernard and Jacob Thomas, for example, published their research paper in 1990 titled "Evidence that Stock Prices do not Fully Reflect the Implications of Current Earnings for Future Earnings" using the average of financial analysts' earnings estimates.
But another reality popped up following Bernard & Thomas' research - the consensus earnings estimate does not necessarily reflect the market's expectation. Mark Bagnoli, Messod Daniel Beneish, and Susan Watts published their paper in 1999 titled Whisper Forecasts of Quarterly Earnings per Share revealing that Whisper Numbers are not only more accurate than consensus estimates, but are also better proxies for price reaction.
The problem with this paper, even though by then whisper numbers were commonly cited, since there was no description for a whisper number in a Finance 101 text book and the implication of the name "whisper number" is secretive, many misinformed lay people, even within the media, were unclear of the definition of a whisper number. Yet it was very clear to financial professionals. In a joint presentation between UBS Warburg and Earnings Whispers in 1999 in Stockholm, UBS' Per Afrell explained their analysts often had up to a 20 page spreadsheet for calculating their estimated quarterly earnings for a company he or she follows and as the earnings release draws nearer, more information is updated in the spreadsheet. This often changes the projection multiple times leading up to the earnings release, but the analyst doesn't issue a new report to revise the firm's official estimate with each change. Yet if a broker within the firm or a client calls the analyst, there is little reason to keep the true expectation a secret. This, as Mr. Alfrel explained, is a whisper number.
Sometimes the new information received leading up to an earnings release will suggest estimates are too low or too high and the analyst will issue a report, but because analysts and all financial professionals tend to be conservative by nature, he or she will discuss the data without revising their numbers. For example, on October 17, 2014, Mark Moerdler, an analyst at Sanford C. Bernstein, issued a report on Microsoft (MSFT) saying that because of the recent strength in the company's cloud business, he expected Microsoft to beat estimates.
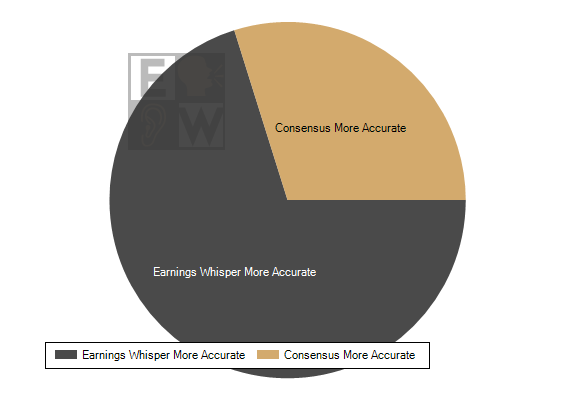
Earnings Whispers is the only firm that attempts to gather the true expectations of professional analysts that differ from the published estimates or from professional buy-side analysts that don't have published estimates. As first reported by a Bloomberg News study in 1999, the Earnings Whisper ® number is more accurate than consensus estimates. In fact, since 1998, Earnings Whispers has published 85,000 Earnings Whisper numbers and were more reliable for predicting actual reported results than the consensus earnings estimates 70.6% of the time. That accuracy isn't important by itself; it only helps to explain the more important reality - the Post-earnings Announcement Drift that has been documented numerous times for roughly 50 years simply does not exist because of an earnings beat or miss of consensus earnings estimates.
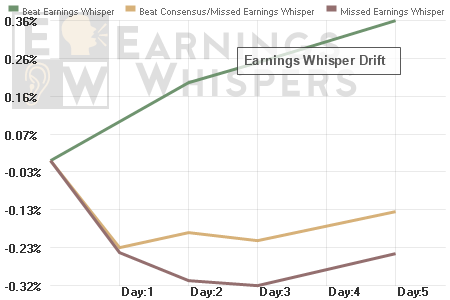
Since 1998, stocks of companies that beat the consensus earnings estimate but miss the Earnings Whisper number, have actually drifted lower in the days following the earnings announcement. Meanwhile, stocks of companies that beat the Earnings Whisper, see their stocks average a drift higher of 0.69% from the open following the news event while those that miss the Earnings Whisper see their stocks drift lower by 0.55% over the subsequent five days. Quite simply, a beat or a miss of the consensus earnings estimate doesn't necessarily mean analysts or fund managers are going to change their models because they were already expecting a number that differed from the consensus. The Earnings Whisper number better reflects this expectation and, thus, better reflects the point where models get revised and investment strategies change. It is also worth noting that these statistics have been consistent throughout the 17 years Earnings Whispers has published earnings expectations.
There is still a problem with this though because the true expectation of the market can't always be expressed in just terms of a simple number. Often expectations are for a "beat and raise", higher subscriber growth, or some other metric. Often, expectations for the quarter might be different than that for the upcoming quarters and stocks reflect future expectations, not past results. Often still, expectations of professional analysts don't necessarily equal the expectations of individual investors. It is for this reason we have a number of different proprietary measures of sentiment, including simply asking individual investors what they think - but not for a specific number.
We have gathered 1.5 million earnings and price sentiment readings from 265,000 individual investors. With this data, combined with the Earnings Whisper number, we've been able to compare actual reported results with an even better measure of the market's true expectation. This, in turn, has helped us more reliably place a stock in Richard Bernstein's Earnings Expectation Life Cycle - a theory we backed into on our own by spending years of researching price reaction to earnings announcements.
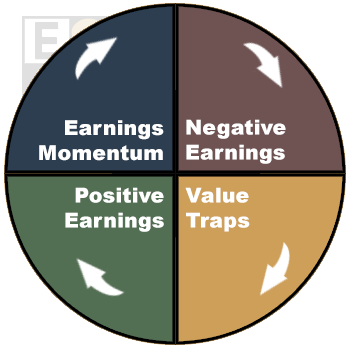
The life cycle, as explained by Mr. Bernstein, the former Chief Investment Strategist at Merrill Lynch, has four primary quadrants as shown in the image on the right. The Earnings Whisper Grade is a value placed on a company's results relative to the cumulative measure of sentiment, including the Earnings Whisper number, prior to the earnings release. Stocks with a passing grade of B- or higher are more likely to be in Bernstein's Positive Earnings phase of the cycle. Stocks with a failing grade of D+ or lower, are more likely to be in the Negative Earnings phase. By default then, stocks with an average grade of C +/- fall into either the Earnings Momentum phase of the life cycle or the Value Traps.
The primary difference between the left hemisphere of the cycle and the right hemisphere is the direction of earnings estimates. Going back to our own Finance 101 days, we learned about price-to-sales ratios, price-to-book ratios, and countless other ways to measure a stock, but we've studied 330,000 earnings releases and 85,000 guidance announcements, with millions of additional data points. We can assure you that little matters more to a stock price than the direction of earnings estimates. Thus, stocks that are Value Traps appear cheap on a price-to-book ratio basis or other valuation methods, but they keep getting cheaper as estimates continue dropping. The opposite is true for Earnings Momentum stocks as prices continue to climb to sometimes bubble-like valuations as estimates continue trending higher.
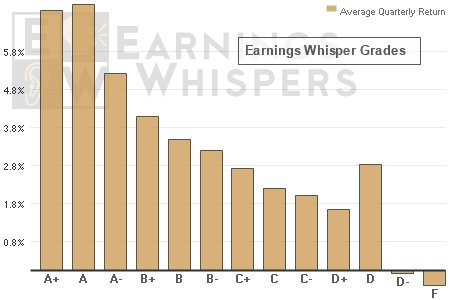
At the time the earnings are announced, we don't necessarily know if estimates are going to continue higher. We do know that stocks that are graded a C, which are either the Value Traps or the Earnings Momentum stocks, on average trade in-line with the overall market. On the other hand, the passing grades outperform and the failing grades underperform.
The top tier of the grading system, the A+'s, have gained an average of 7.93% from the two days following the company's earnings release until the close just before its next earnings release - outperforming the overall stock market by 259% per quarter. The stocks with an Earnings Whisper Grade of F, on the other hand, traded lower by an average of 2.78% during the quarter while stocks rose on average.
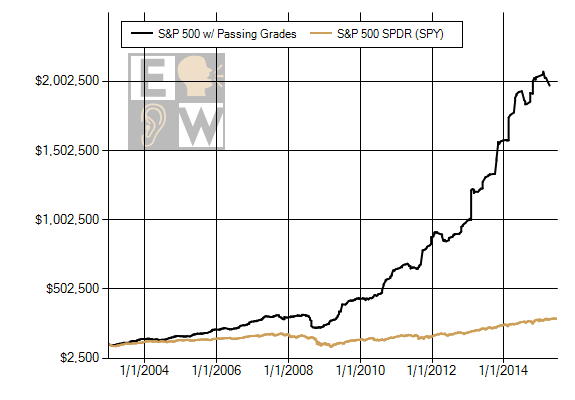
What does such a return look like for an individual investor? The chart below shows a model $100,000 portfolio with the strategy of buying one S&P 500 stock each week (up to a maximum of 10 per quarter) that received an Earnings Whisper Grade of B+ or better and holding the stock until the day just before its next earnings release (with $8 commissions). From the start of 2003 until the middle of 2015, this portfolio would have gained 1,900% to be worth approximately $2.0 million, while an investment in the S&P 500 would have gained 139% and be worth $239,000.
Click here for the Current A+'sClick here for the Latest Grades
Past performance is not an indicator of future success