Earnings Research
Earnings Whispers is, first and foremost, a research firm that focuses on gathering the most accurate earnings expectations for upcoming earnings releases. We were founded in 1998 in direct response to poor and inaccurate earnings information being promulgated by some as a "whisper number". Most of these numbers were in contrast to well-known expectations of investment professionals and, thus, Earnings Whispers was launched to gather these professional earnings expectations.
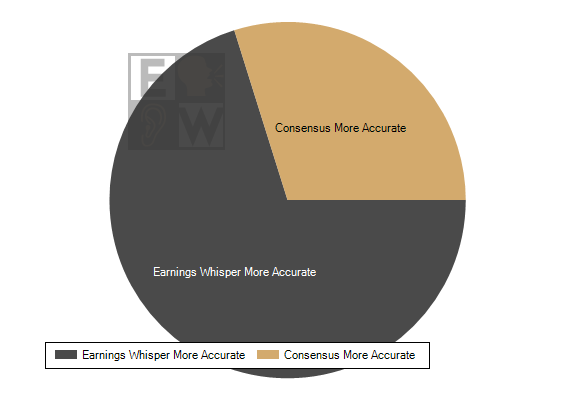
Since then, we have published 129,071 Earnings Whisper ® numbers gathered from 11,983 professional buy and sell-side analysts. Over the past 28 years, the Earnings Whisper number has been the most accurate published expectation 71.9% of the time.
For this reason, Earnings Whispers has been the go-to source for earnings expectations by hedge funds and other asset managers, brokers, individual investors, and traders for 28 years.
Investor Sentiment
While the professional analysts are the ones kicking the tires, important information can be gained by tracking expectations of the individual investor. Individual investors range from those that perform in-depth research to those just sticking their finger in the air. We have gathered 14,661,323 sentiment readings from 1,420,174 individual investors, and this gives us important information about a stock going into the company's earnings release or following the announcement. The best trades come when professional analysts' expectations differ from the individual investors' and only Earnings Whispers takes advantage of these discrepancies.

Quantitative Analysis
We are data scientists. We like looking at numbers. We study and analyze numbers. We study others' analysis and research. We have literally run through thousands of studies on 626,515 earnings releases and 158,658 guidance announcements to date. From a quantitative perspective, we are confident we know what information around earnings indicates a statistical edge that the stock will move in a particular direction.
We have been able to combine this information into three proprietary algorithms that have shown to significantly outperform the overall market - more so than any research study we have seen.
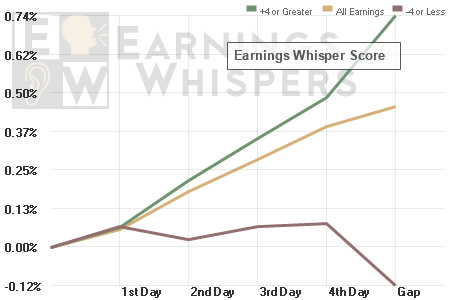
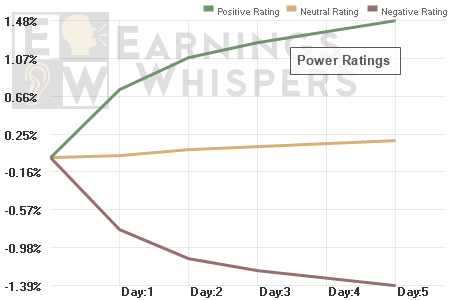
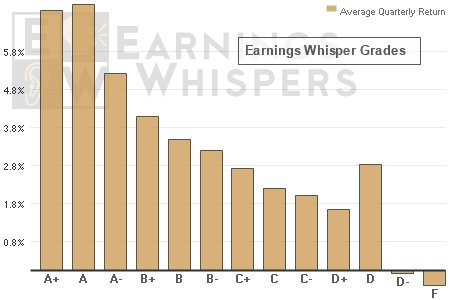
The Earnings Whisper Score gives us a statistical edge for trading long or short ahead of a company's earnings release. The Power Rating indicates how much short-term strength or weakness is likely if bought at the open following the company's earnings release. The Earnings Whisper Grade identifies which stocks are more likely to see a Post-Earnings Announcement Drift (PEAD).
Technical Analysis
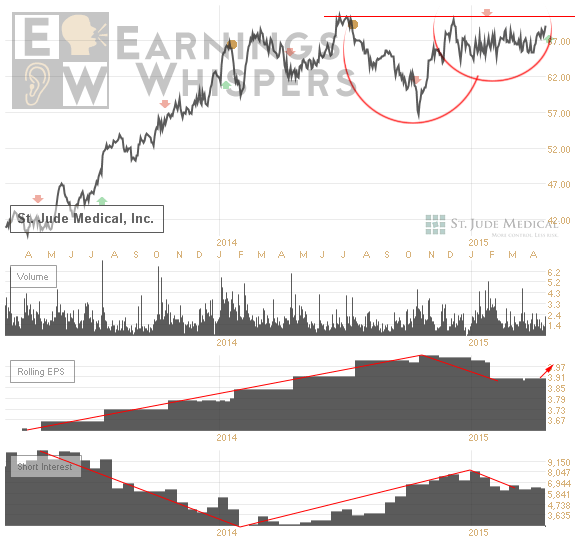
Finally, we are chartists. Once we know which stocks are more likely to move in a particular direction either before or after earnings, we then go to the charts to put it all together. We identify areas of support and resistance, and any specific technical setups. Quite simply, it helps to know where the stock is likely to go and it is even more important to know where things can go wrong so that small loses don't turn into big losses. If the chart doesn't match the data, then it is usually better to sit on the sidelines.
For example, on April 22, 2015, St. Jude Medical (STJ) reported earnings of $0.93 per share. This was above the consensus earnings estimate of $0.91 per share and the Earnings Whisper ® number of $0.92 per share. The chart showed a cup & handle pattern had formed prior to the company’s earnings release and the stock opened above the “lid” of the chart, providing an area of support underneath. The stock went on to gain 5.50% during the two-day trading period following the news.
