Earnings Whisper Power Rating
the most powerful short-term stock price indicator

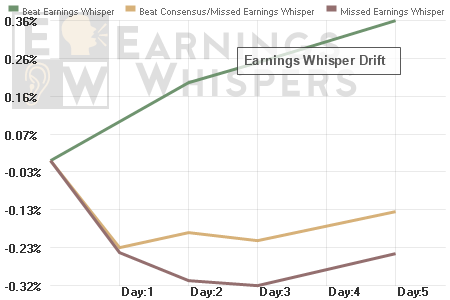
We know what makes stocks go higher or lower following a company's earnings release and it isn't a secret. It has been researched and documented countless times since Ray Ball and Philip Brown published their paper "An Empirical Evaluation of Accounting Income Numbers" back in 1968 - the paper that introduced the world to the stock market phenomenon called the Post Earnings Announcement Drift (PEAD). Stocks "drift" higher from their opening price following an earnings beat and lower when they miss expectations.
What isn't quite as well known is what truly makes up an earnings surprise. Back in 1968, Messrs. Ball and Brown used "normalized" earnings growth. A couple of decades later, research studies found the phenomenon still existed when companies beat or missed consensus earnings estimates. In the late 1990s and early 2000s, studies revealed that the drift was greater relative to the whisper number and since then, our numbers suggest the market ignores consensus estimates and the drift only occurs relative to the Earnings Whisper ® number.
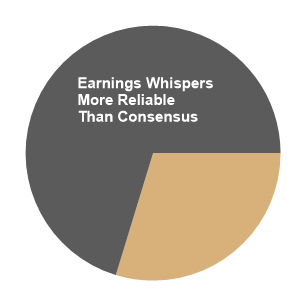
At Earnings Whispers, our number one job is to be analysts of analysts and the Earnings Whisper number reflects a combination of analysts' checks, expectations that differ from their published estimates, and their own track records and the data comes from both buy and sell-side analysts. We have published an Earnings Whisper number 85,000 times and 70.6% of the time the Earnings Whisper number was more reliable at predicting actual reported earnings than the consensus estimate. Because of this track record, the Earnings Whisper number has become the most followed alternative to the consensus earnings estimates.
However, it is the source of the data used in determining the Earnings Whisper number that makes the projection a better indicator for stock price reaction. By gathering the true expectations of the professional analysts - the ones getting paid primarily by institutional money managers - we are more likely to have the true expectations of the investors that are more likely to move stock prices. For example, since the start of 2012 until the middle of 2015, the percentage of ownership among S&P 500 stocks held by institutional investors increased by approximately 370 basis points while individual investors participation declined.
In order for an investment model to change, a company's results generally do not need to differ from consensus estimates but rather the Earnings Whisper number.
Still, expectations can't always be summed up into one single number, which is why we have gathered the largest database of investor sentiment for both reported results and stock price reaction ahead of companies' earnings releases. In order to determine the potential "drift" following an earnings announcement, the results relative to the Earnings Whisper number, are then compared to our proprietary measure of investor sentiment. The results are compiled into a single indicator on a scale from 0 to 100 with 100 showing the most potential strength and zero showing the weakest strength.
Much of the same information that goes into the Earnings Whisper Grade, which measures the potential longer-term drift (approximately 90 days) following an earnings release also goes into the Power Rating except our research has found that longer-term moves depend more on the quality (or lack thereof) of the earnings and the short-term moves are more impacted by sentiment going into the news. Either way, nearly all studies of the PEAD phenomenon found most of the drift occurs during the first several trading days following an earnings release, and the Power Rating measures just such a move.
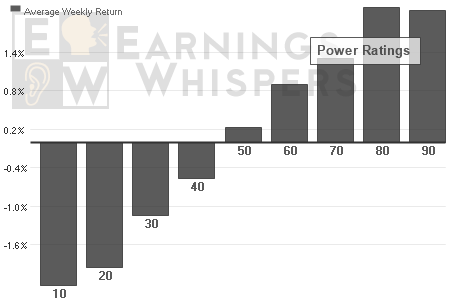
The stocks with the lowest Power Ratings average a decline of approximately 3% from their open after reporting earnings until the close five days later while those with the highest Power Ratings average approximately a 3% gain.
Part of the fuel driving the stocks in either direction is inherent in the earnings release as stocks naturally see their biggest moves around an earnings release. For example, shares of Apple over the past 15 years have averaged an absolute move of 3.75% on any week the company wasn't reporting earnings, but averaged a 6.0% move on weeks the company has reported earnings. By identifying the top and bottom octile of earnings surprises relative to expectations traders can better take advantage of these moves.
The top eighth of the earnings releases have a Power Rating of 67 or higher and the bottom eighth have a Power Rating below 35. The positive ratings average roughly a 2.0% move from the open following the company's earnings release until the close five trading days later and those with a negative rating see a similar move in the opposite direction. A 2.0% one-week average gain calculates to an annualized return of approximately 100% before commissions and without compounding returns.
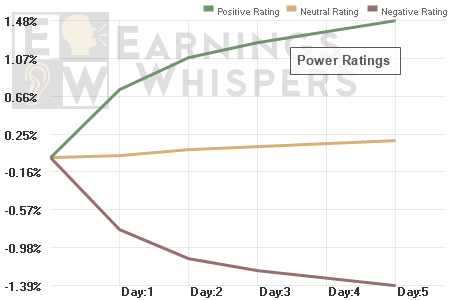
By ignoring 75% of the earnings releases and only trading stocks with positive or negative Power Ratings after earnings, a trader can significantly outperform the overall stock market and see profits regardless of the direction of the overall market. One simple trading strategy is to buy one stock with a Power Rating of 67 or higher at the open following its earnings release and holding the position for five days while also shorting another stock with a Power Rating of 35 for the same or similar period.
The chart below shows the results of investing $20,000 in the S&P 500 at the start of 2003 compared trading $10,000 on the long side and $10,000 on the short side using such a strategy. A more aggressive trader might increase the trading size as the portfolio grew, which would increase the overall returns, but this simple, more conservative, market neutral strategy would have outperformed the S&P 500 by approximately 575% through the middle of 2015.
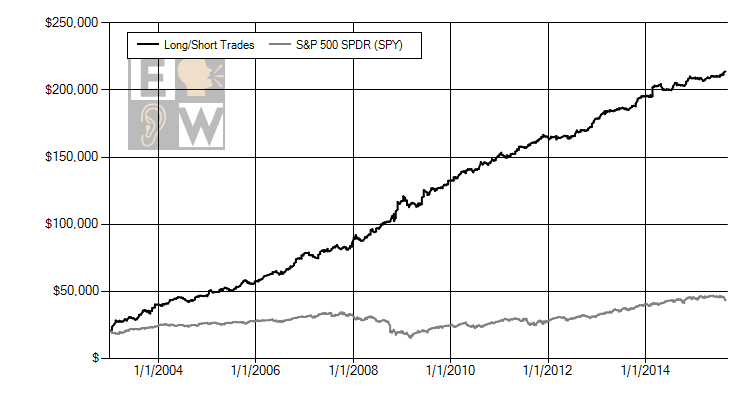
Hypothetical trades selecting the first met criteria of each week. Past performance is not an indicator of futures success.
The Power Rating can be found by clicking on the latest earnings details for any company. We also provide a list of all Power Ratings for each trading day.
Click here for the Today's Power Ratings